 About Us
 Why K12?
 Safety Needs
 How Students Succeed
 FAQs
FAQs Online Elementary School
 Online Middle School
 Career and College Prep
 Online High School
 Student Clubs
 Career and College Services
 Inside the Online Classroom
 A Day in the Life
 Social & Extracurricular
 Advice, Tips & Inspiration
 Benefits for Life
 Enroll
 All School Options
 Need More Help?
Why Back-To-School Shopping Got So Hard
Trends move faster, kids care more about brands, and parents are feeling the pressure. Here's what 1,000+ parents told us about back-to-school in 2026.
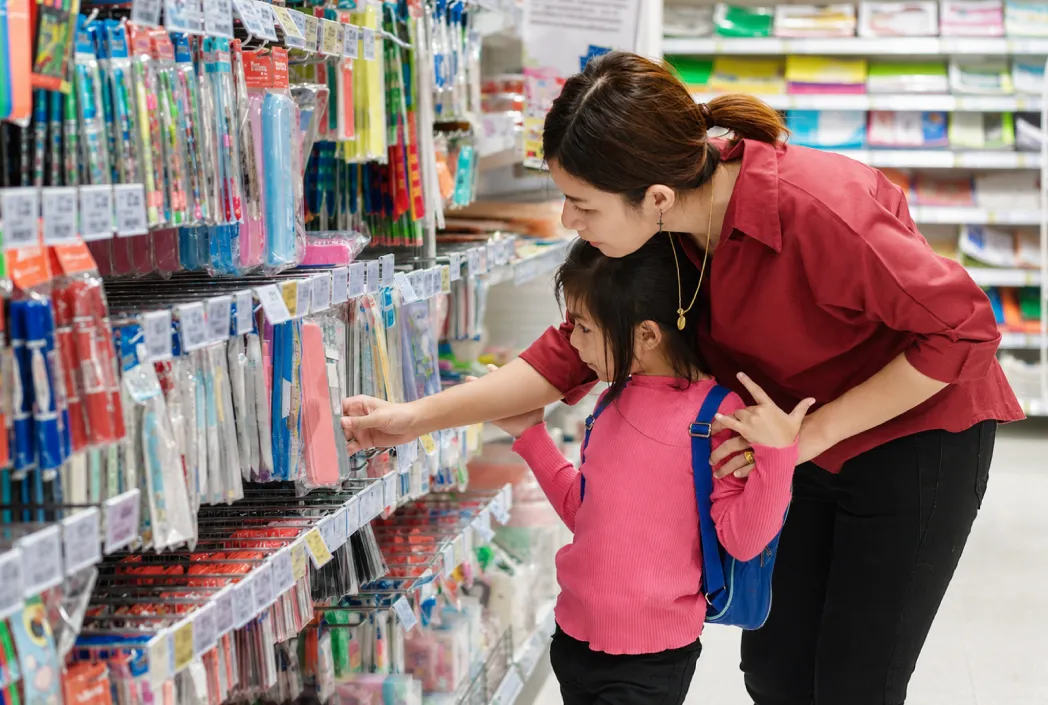
Table of Contents
Kids have always used their stuff to express themselves, whether it’s their lunchbox, shoes, folder, or backpack. That part isn’t new. What’s changed in 2026 is how often they (or their friends) hear about trends through social media, and how quickly that exposure shifts what they want when it’s back-to-school time.
To understand what’s behind today’s choices, we surveyed 1,007 American parents with K–12 children (not affiliated with K12) and compared their answers with two years of Google search-volume data across 336 back-to-school keywords. We found what’s driving kids’ choices, where parents are feeling the pressure, and why a number of families are looking for something different.
Key Takeaways
- 43% of parents say their child cares more about brands now than a year ago, and more than one in four (29%) say TikTok and YouTube creators are driving their child’s back-to-school wish list.
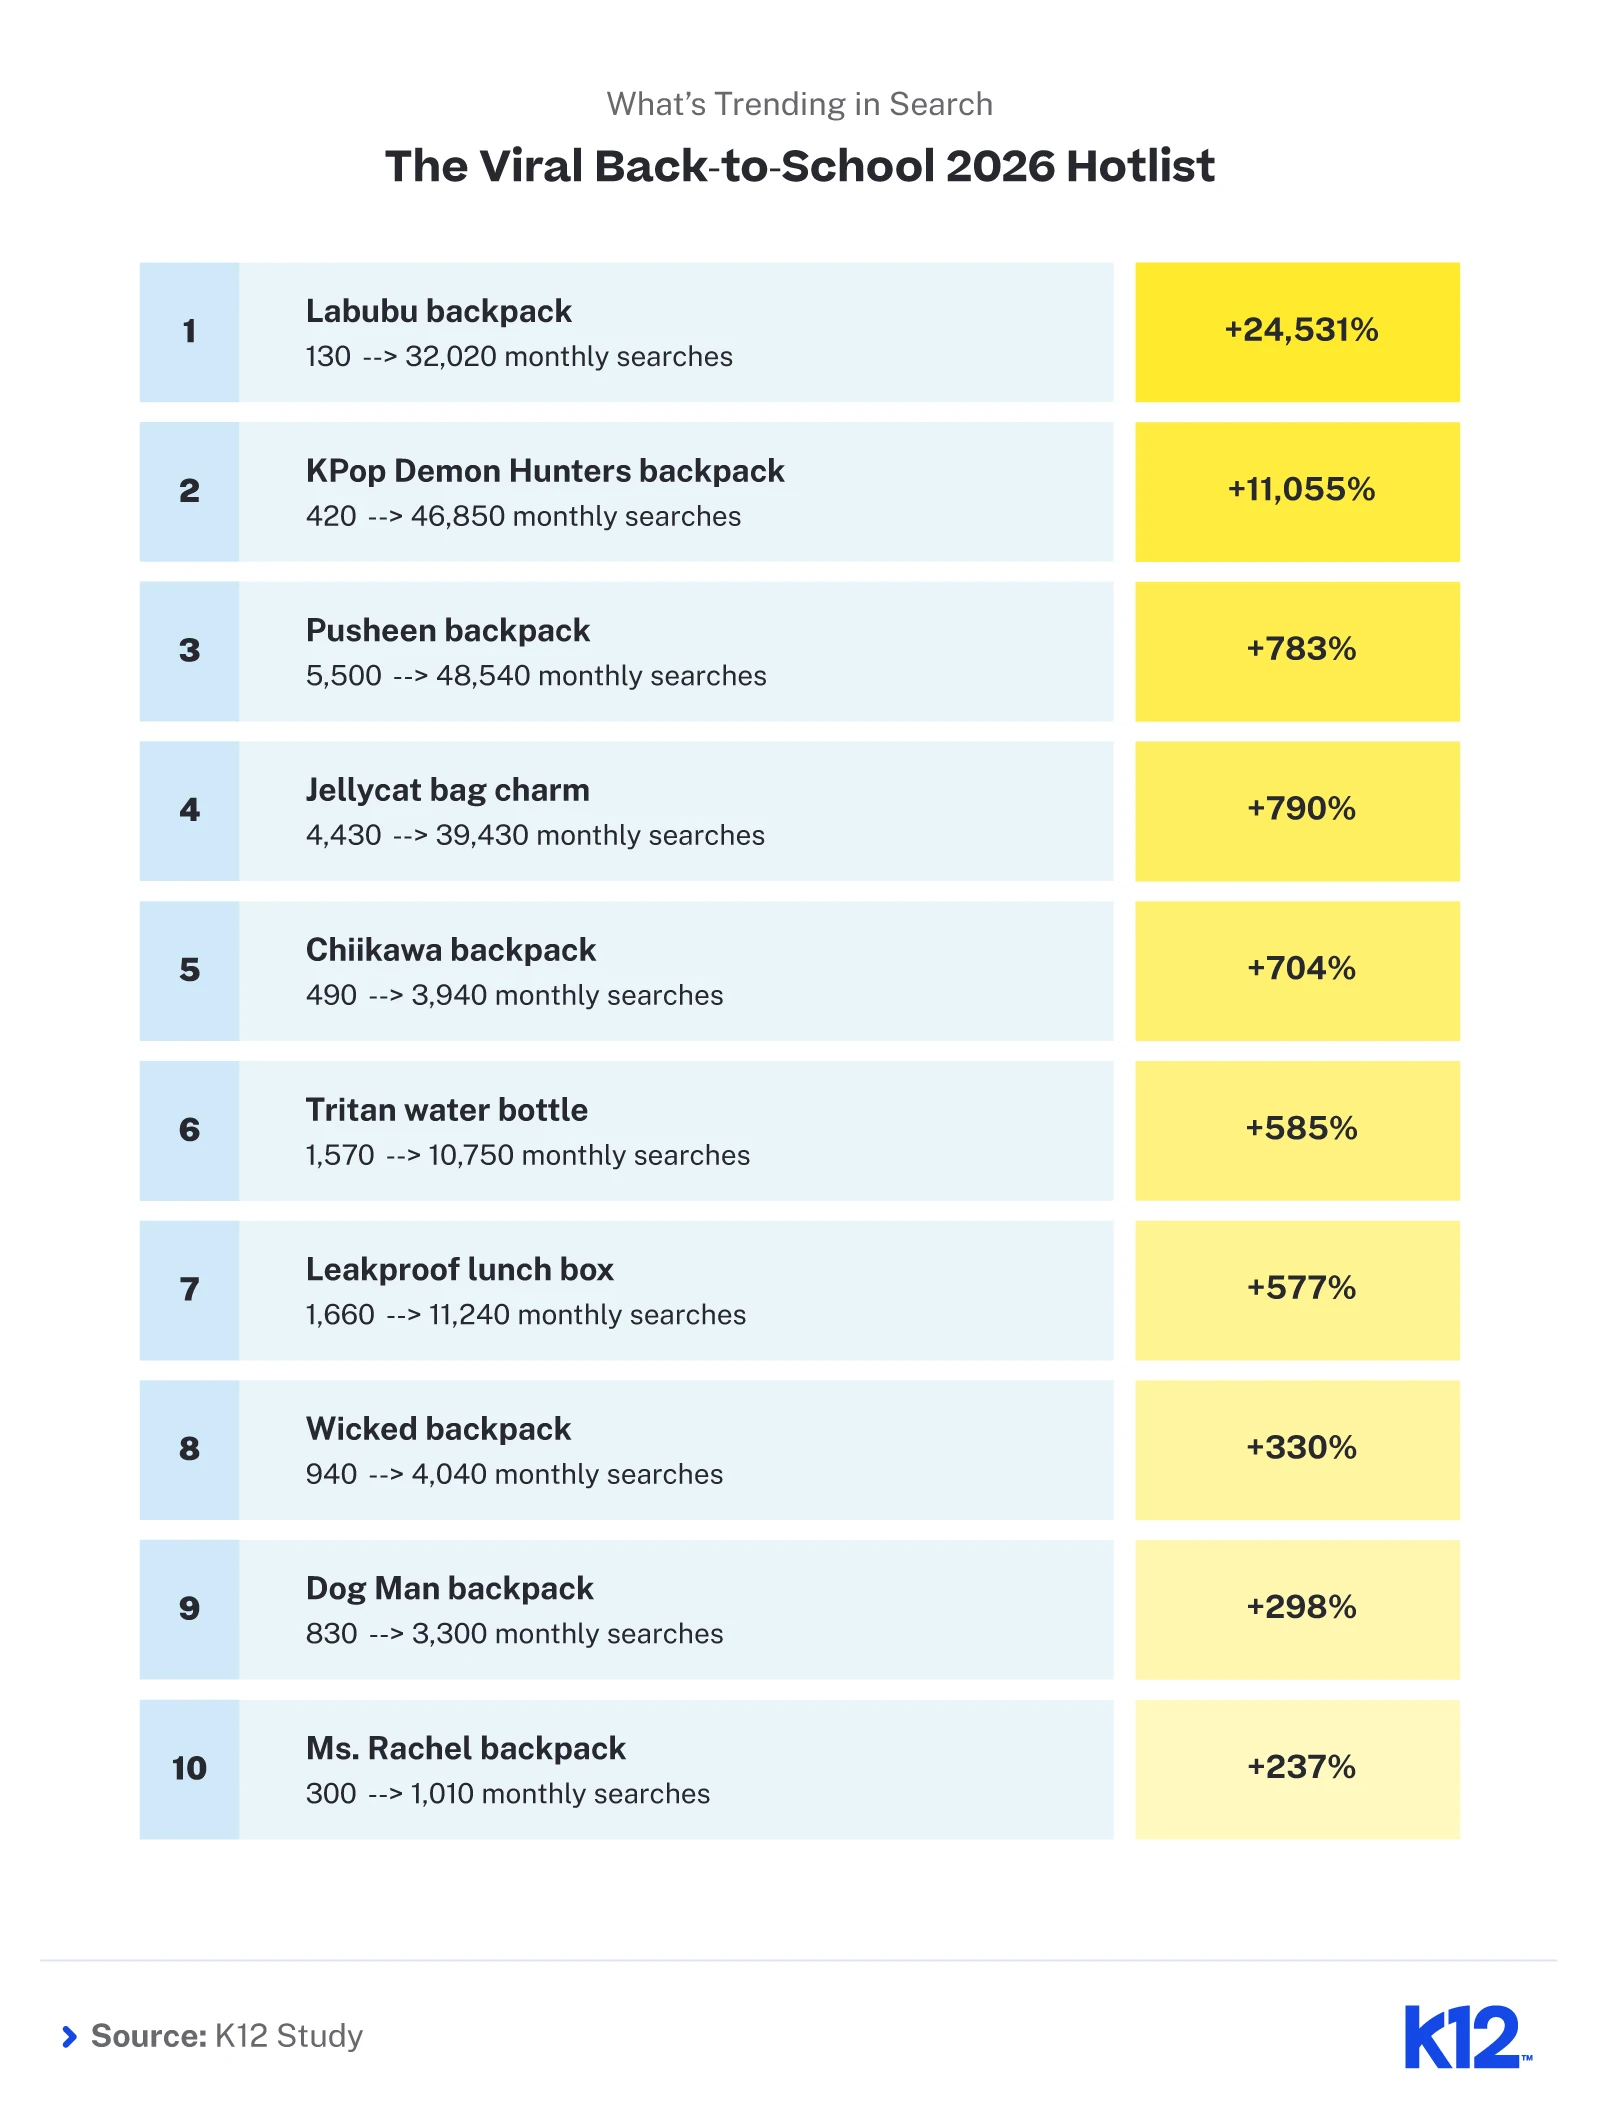
- The top three items on the 2026 back-to-school search hotlist are: Labubu backpack (+24,531% YoY at the August 2025 peak), KPop Demon Hunters backpack (+11,055% from June to August 2025), and Pusheen backpack (+783% YoY).
- 49% of parents say that back-to-school shopping has become more stressful than it used to be.
- Nearly one in five parents (19%) have considered switching their child to online school or homeschool because of back-to-school shopping pressure.
- Searches for “homeschool curriculum” climbed +226% YoY at the August 2025 peak, but 35% of parents don’t know that tuition-free online public schools exist.
- Among parents whose children attend K12-powered online schools, 94% were satisfied with their child’s teachers, compared with 81% of parents with children in traditional schools.
The Characters and Trends Kids Are Choosing
Search data shows exactly which fandoms and aesthetics kids are claiming as their own this year. Labubu backpack searches grew from 130 monthly searches in August 2024 to 32,020 at the August 2025 back-to-school peak, a +24,531% year-over-year jump. “KPop Demon Hunters backpack” searches climbed from 420 to 46,850 between June and August 2025, an +11,055% lift fueled by the film’s Netflix release that June. Pusheen backpack searches grew +783% YoY.
Bag charms had a breakout year as kids added tiny identity statements onto everything they carried. At the August 2025 peak, Labubu bag charm searches grew +808%, Jellycat bag charm grew +790%, beaded bag charm grew +738%, and plush bag charm grew +349%.
When Search Interest Turns Into Shopping Pressure
When a back-to-school wish list changes as fast as social media trends, shopping gets harder. Parents are caught between wanting their child to feel confident on day one and sticking to their budgets.
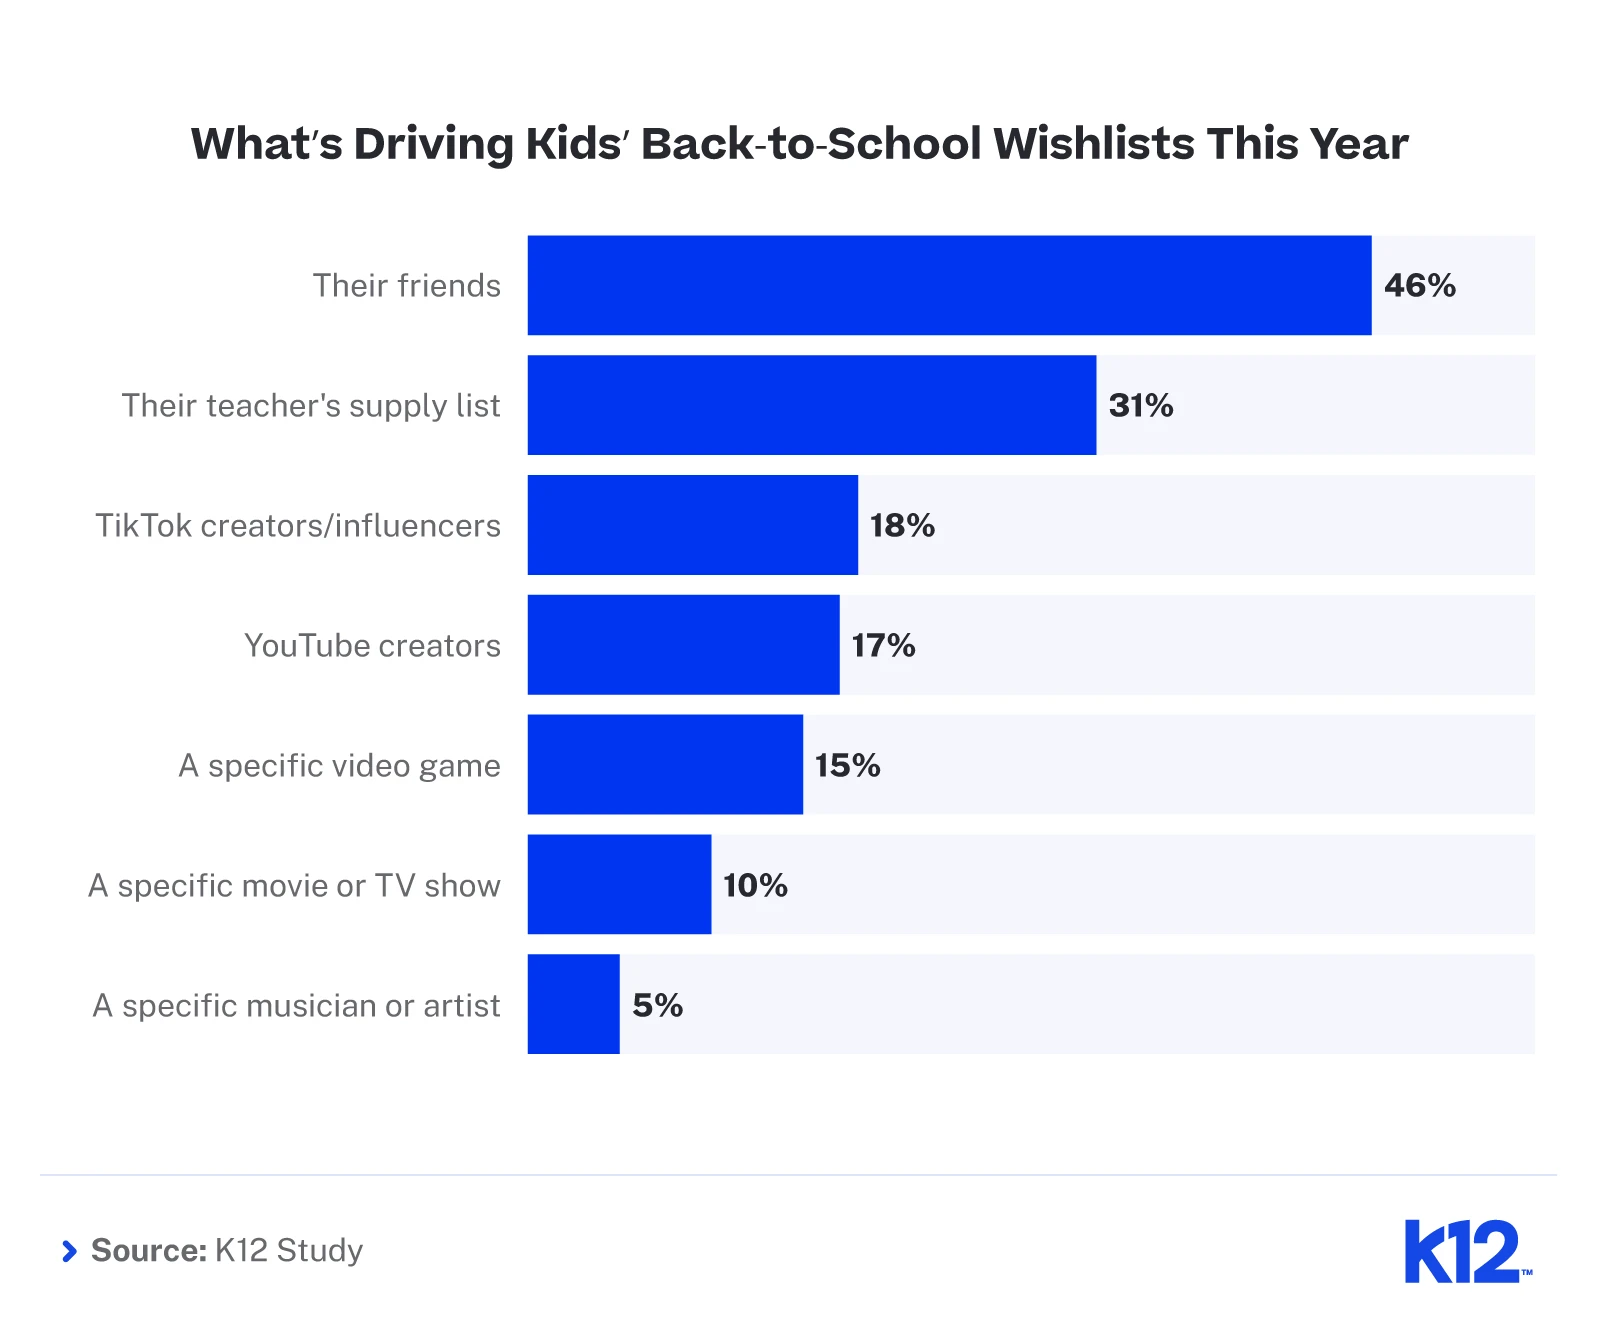
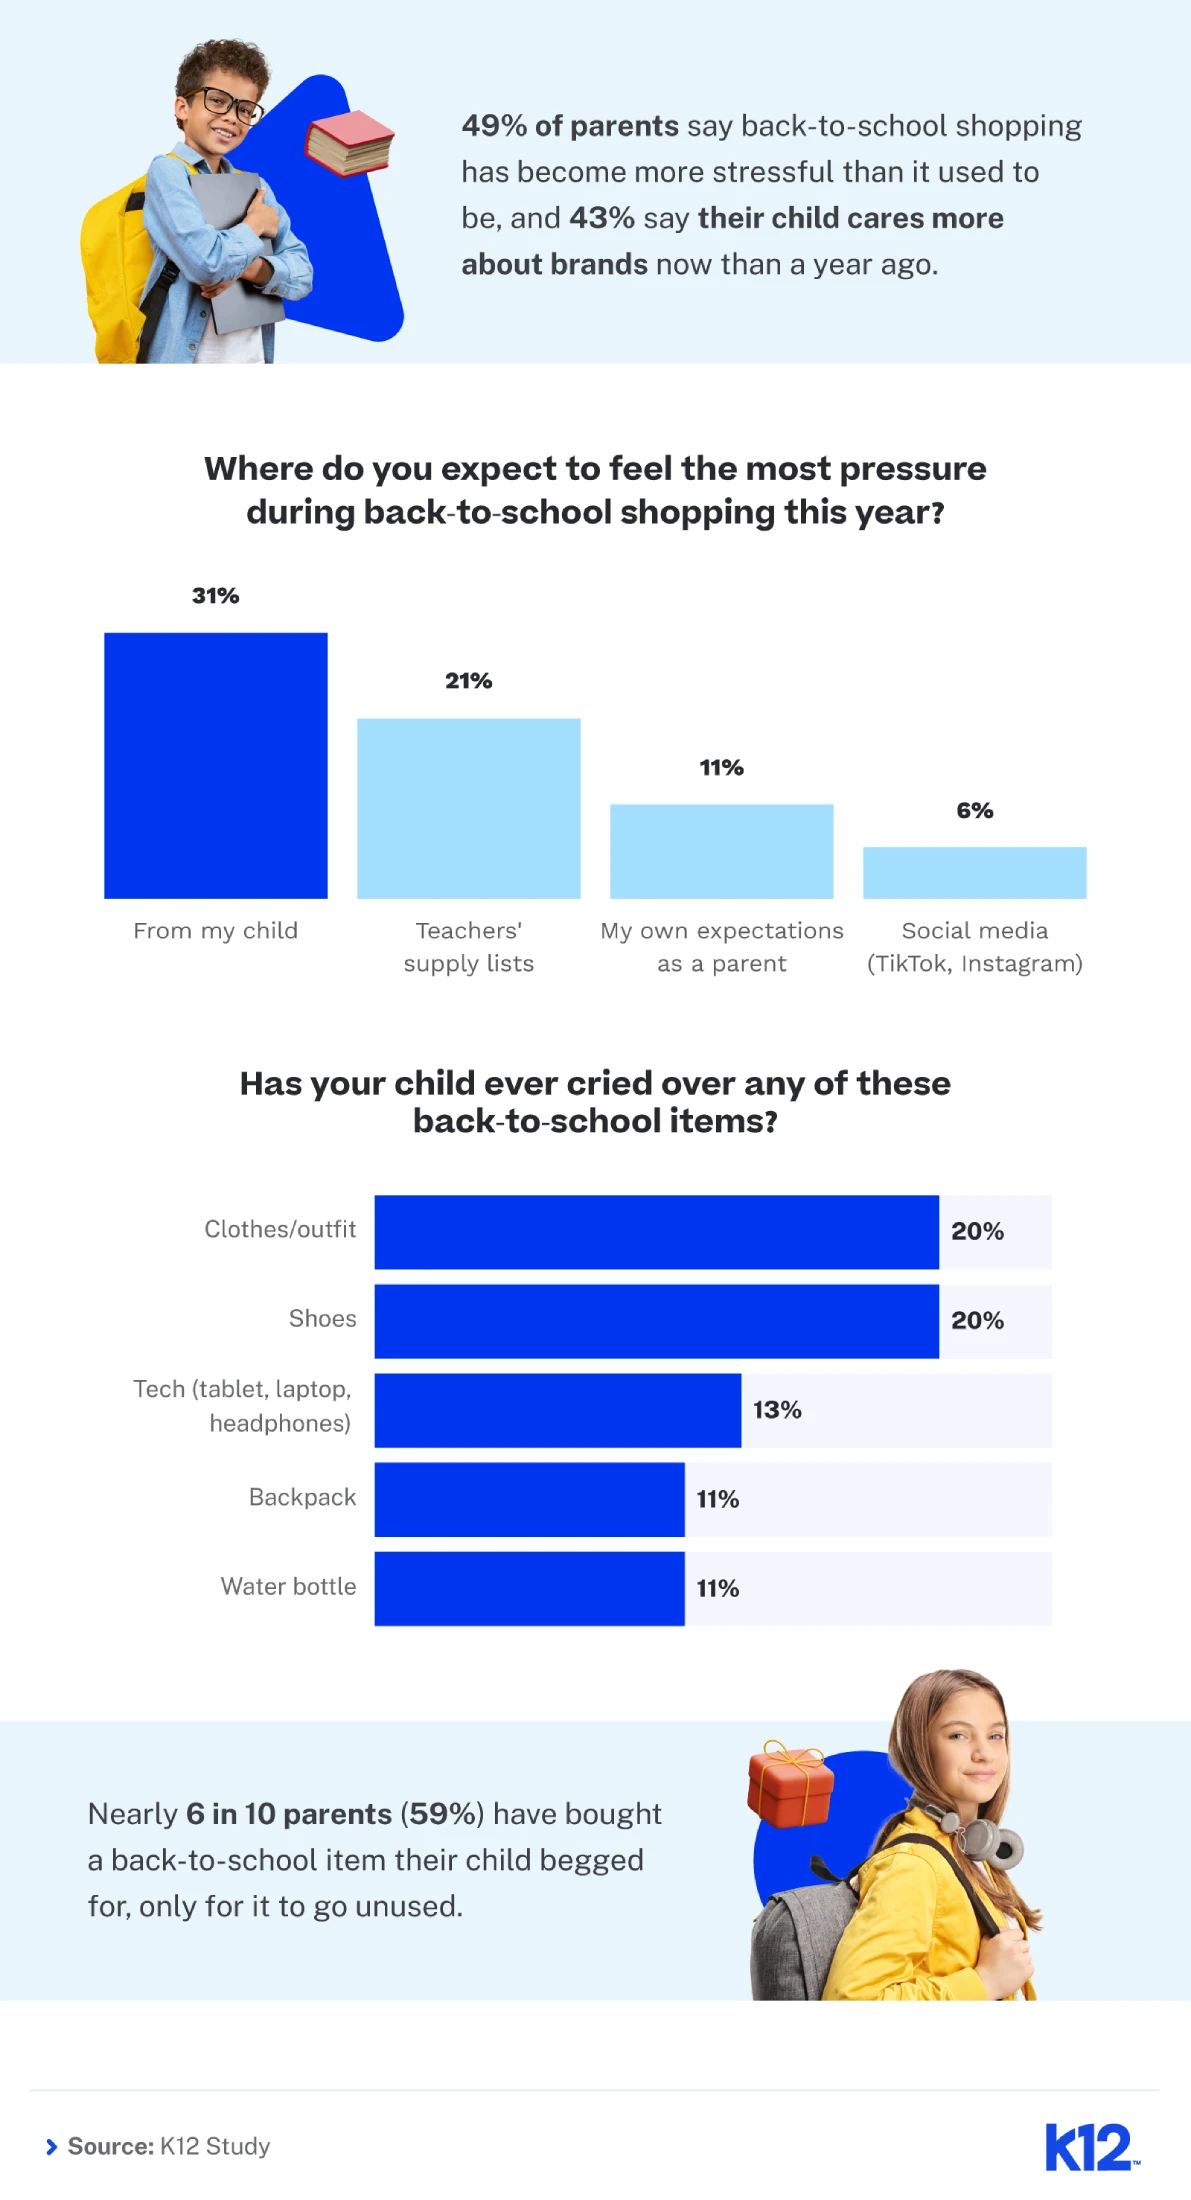
Nearly half of parents (49%) said back-to-school shopping has become more stressful than it used to be. When asked where that pressure was coming from this year, they pointed to:
- Their own child (31%)
- Teachers’ supply lists (21%)
- Their own expectations as a parent (11%)
- Social media like TikTok and Instagram (6%)
More than one in three parents (36%) said their child has cried over a back-to-school item, most often clothes (20%), shoes (20%), or tech like a tablet or laptop (13%).
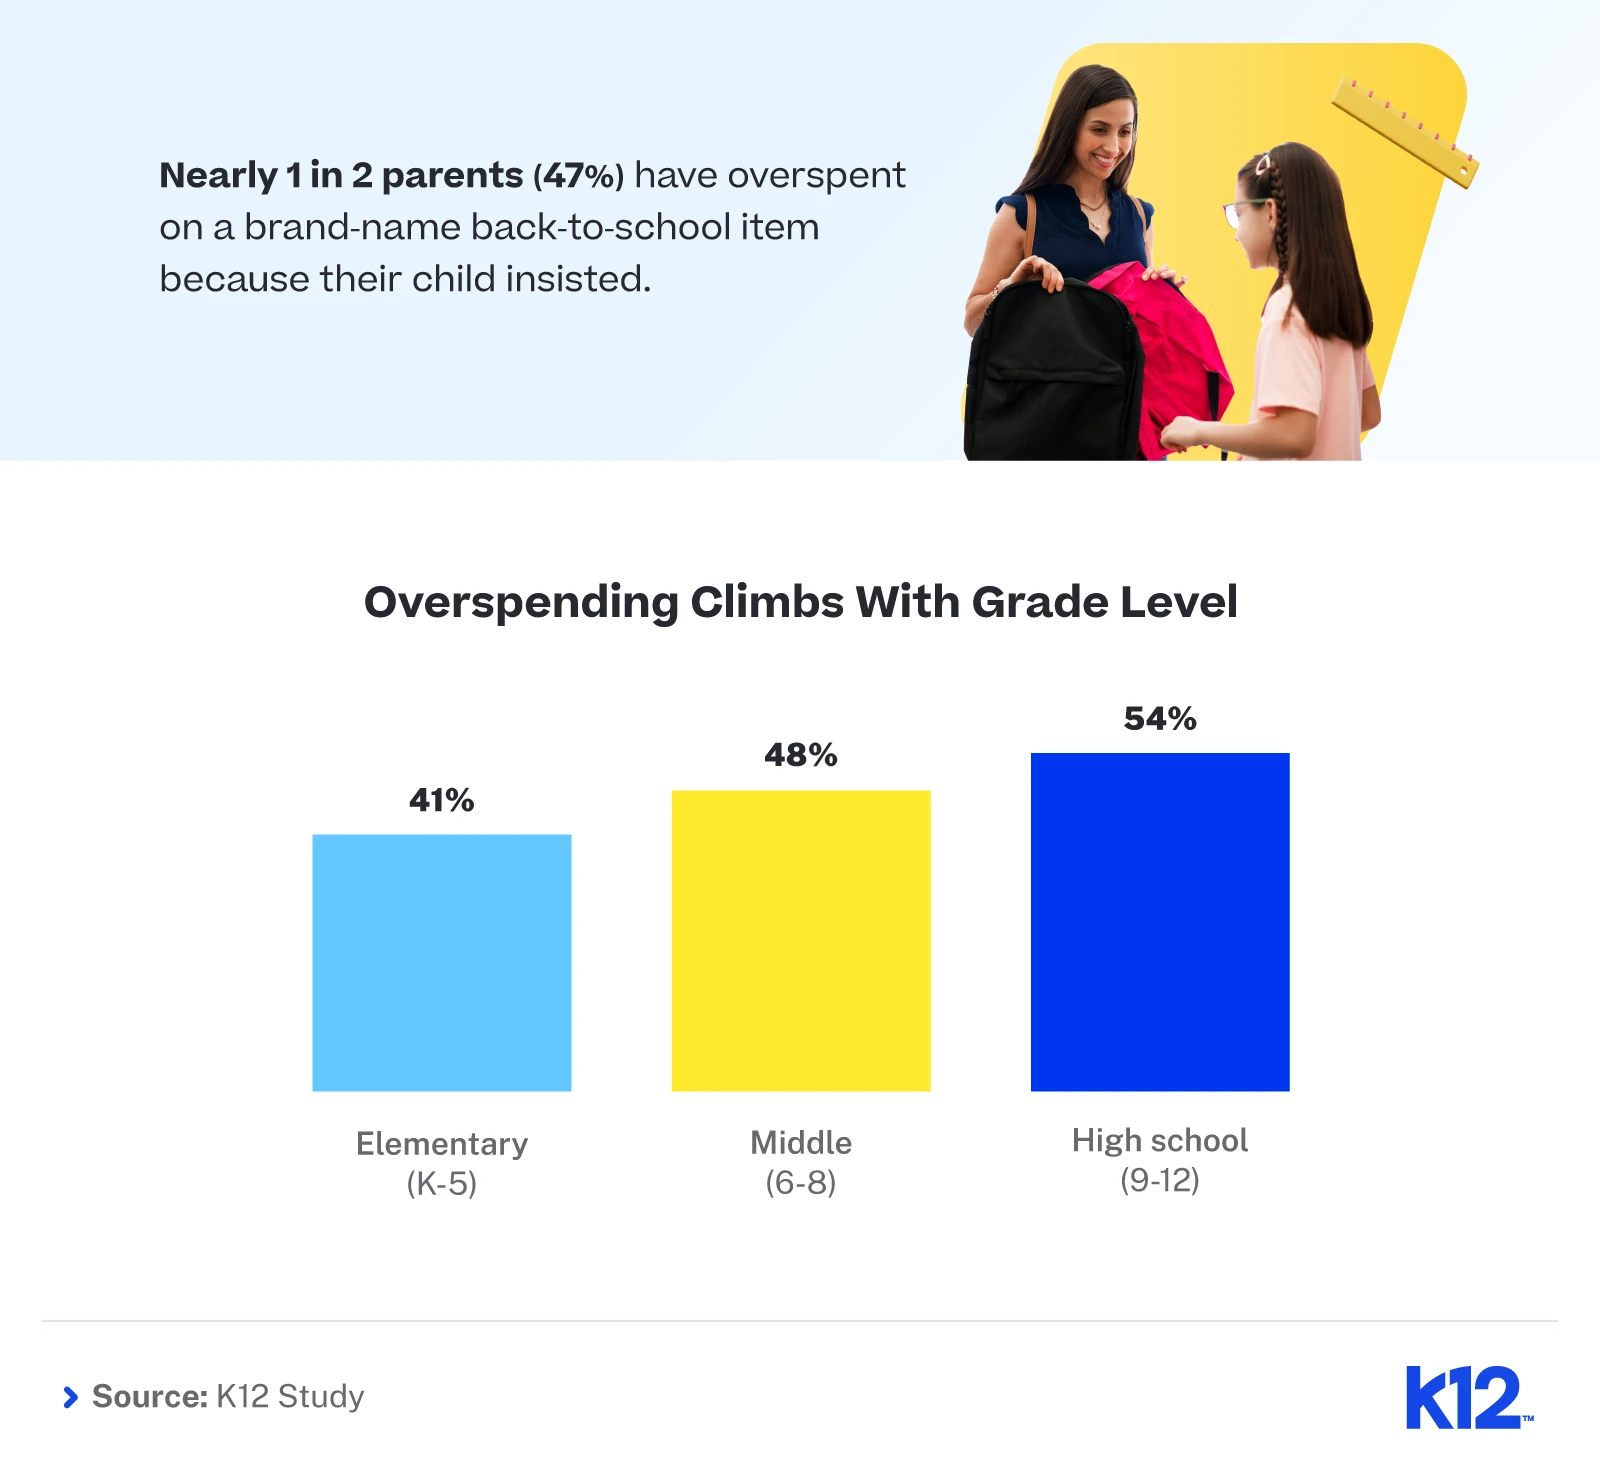
Nearly half of parents (47%) said they have overspent on a brand-name back-to-school item because their child insisted, and the rate climbs with grade level:
- Elementary (K–5): 41%
- Middle (6–8): 48%
- High school (9–12): 54%
The further kids get from elementary school, the more brand identity matters and the harder it gets for parents to say no. In fact, 43% of parents said their child cares more about brands now than a year ago, and 47% agreed or strongly agreed that social media has made back-to-school shopping more expensive.
The pressure has gotten real enough that 17% of parents have passed off a knockoff back-to-school item as the real thing, and 33% have bought a back-to-school item specifically for how it would look in their child’s first-day-of-school photo.
When asked what they consider the biggest back-to-school wastes, parents named:
- Anything tied to a trend that fades by midyear (52%)
- Designer or brand-name clothing (33%)
- Trendy or character-themed supplies (25%)
- Tech accessories (18%)
The viral hotlist and the regret list overlap a lot. Parents know the trends fade. They buy them anyway because kids care now, in the moment, and that’s a hard thing to talk a 12-year-old out of in August.
Families Are Searching for Something Different
There’s a quieter trend running underneath all of this, and it’s the one most worth paying attention to. Some families aren’t just adjusting their shopping. They’re starting to question the setup entirely. Searches for “homeschool curriculum” climbed +226% YoY at the August 2025 peak, growing from 35,020 to 114,010 monthly searches.
Our survey data backs that up. Nearly one in five parents (19%) have considered switching their child to online school or homeschool specifically because of back-to-school shopping pressure; 8% said they’ve seriously considered it, and 11% said they’ve thought about it briefly. That’s a meaningful share of parents actively exploring different educational options, and many of them don’t yet know there’s a path between traditional public school and homeschooling their kids themselves.
Online public schools fill that gap. In many states, tuition-free, accredited schools follow state standards and award high school diplomas. They give families more flexibility in how learning happens day-to-day and allow students and families to focus on learning first — putting trending school gear in the backseat.
Finding What Works for Your Family
Back-to-school shopping doesn’t have to mean chasing every trend or stretching the budget on items that may not last past October. The data shows that many parents are already adjusting their approach, whether that means shopping differently, talking with their kids about what’s worth the spend, or, in some cases, rethinking the whole school setup. Whatever this season looks like in your home, the kids who feel supported and the parents who don’t feel cornered tend to land in the same place: ready for the year ahead.
Methodology
This study combined a national parent survey with Google search-volume analysis to examine how kids are signaling their identity through back-to-school choices in 2026, the pressure those choices create at home, and why a growing number of families are exploring different setups for the school year.
The survey included 1,007 American parents with children in kindergarten through 12th grade. Respondents were not affiliated with K12. The survey explored where parents feel back-to-school shopping pressure comes from, how that pressure affects their children, how much they plan to spend per child this year, how often kids drive the wish list versus the supply list, the back-to-school items they have privately admitted to buying or regretting, and how often parents overspend on brand-name items because their child insisted.
Among respondents, 68% identified as women, 32% as men, and fewer than 1% as nonbinary or preferred not to say. Generationally, 1% were Baby Boomers, 30% were Gen X, 67% were Millennials, and 2% were Gen Z. Regarding their children’s grade levels, 39% had children in elementary school (K–5th grade), 28% in middle school (6–8th grade), and 33% in high school (9–12th grade). Meanwhile, 90% were traditional school families, and 9% were at-home learning families (n=88); statistics specific to the at-home subset are labeled accordingly.
The study also analyzed Google search-volume data for 336 back-to-school retail keywords from March 2024 through March 2026, covering two full back-to-school shopping cycles (2024 and 2025) plus the early bird 2026 window. Year-over-year comparisons focused on the back-to-school peak month (August 2025 vs. August 2024) to capture the height of family back-to-school shopping behavior, with secondary analysis structured around the actual shopping phases families move through each year:
- May to June: Early bird shopping phase
- July: First major back-to-school shopping window
- August: Peak back-to-school season
- Late August through September: Clearance and last-minute shopping phase
To distinguish genuinely back-to-school-driven trends from items growing for unrelated reasons, each keyword was evaluated against a hybrid back-to-school spike test: items qualified as BTS-driven if either (a) their average July–August 2025 search volume was at least 2.0x their average of all other 2025 months, or (b) their August 2025 volume was at least 2.0x their July 2025 volume. The second criterion ensures items with strong year-round demand (such as those that also spike at holidays) are still captured if they show a clear back-to-school surge.
The search-trend findings in this report are based on data through Q1 2026 and reflect trend momentum across two prior back-to-school cycles. Findings will be refreshed with May through August 2026 search-volume data as it becomes available, allowing the rankings and trend data to reflect the most current back-to-school season behavior. Survey findings are point-in-time and reflect parent attitudes captured in the survey window.
Percentages have been rounded to the nearest whole number, so some totals may not sum to 100%. Parent satisfaction figures for K12-powered online schools reflect K12’s published satisfaction data and are separate from this survey.
Fair Use Statement
The information in this article may be used for noncommercial purposes only. If shared or referenced, proper attribution with a link back to K12 must be included.